

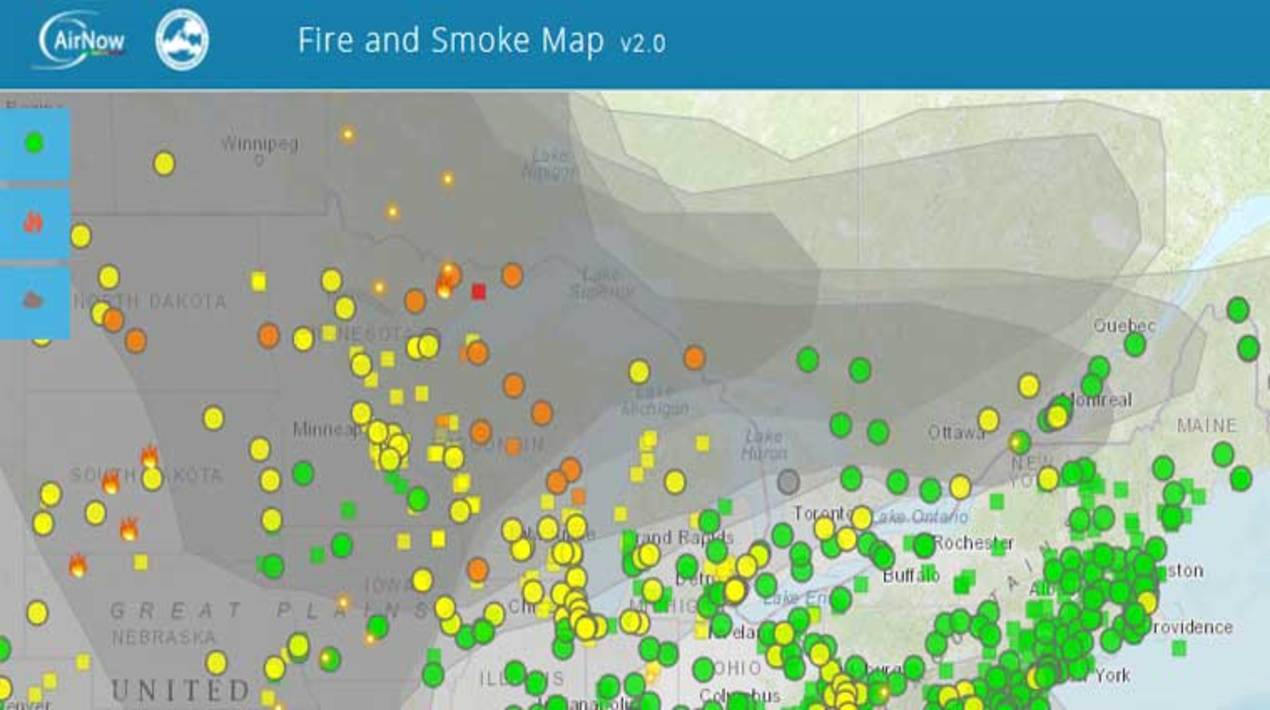
The Environmental Protection Agency and the U.S. Forest Service (USFS) have released updates to the AirNow Fire and Smoke Map to help protect communities from the effects of wildfire smoke. Started as a pilot project last year, the map pulls data from three sources: temporary monitors such as those the Forest Service and other agencies have deployed near fires; crowdsourced data from nearly 10,000 low-cost sensors nationwide that measure fine particle pollution, the major harmful pollutant in smoke; and monitors that regularly report to AirNow, EPA’s one-stop source for air quality data.
The agencies announced improvements to the map, including a dashboard that gives users quick access to information that can help them plan their outdoor activities, the current Air Quality Index (AQI) category at the monitor or sensor location, data showing whether air quality is improving or worsening, and information about actions to consider taking based on the AQI.
EPA and USFS developed the map-pilot to provide information on fire locations, smoke plumes and air quality in one place. It had more than 7.4 million views in its first three months. The map imports data from almost 10,000 sensors from an air quality sensor network that crowdsources data on particle pollution, providing real-time measurement of air quality on a public map. This was a logical addition to two other projects already underway.
The extra data points the sensors provided proved useful in characterising air quality during the 2020 fire season, and we had positive reception from state, local and tribal air agency partners, and from the public. The map is intended for individuals to use in making decisions about outdoor activities based on air quality, but the unique fire, smoke and concentration data can help increase awareness of the significant impacts of wildfires across all levels of government — federal, state, local and tribal — and provide a valuable tool to assist agencies as they work to protect public health from wildfire smoke during these emergencies.
Officials can use the map to compare current air quality from the three main data sources and to view fire locations, basic fire information and smoke plume information. Most sensors are operated by private citizens monitoring air quality where it is important to them. The sensor users can choose to contribute their data to a public crowdsourced database. Sensor data is transmitted by Wi-Fi back to the database.
To make the data more comparable to smoke monitor data on the AirNow Fire and Smoke Map, EPA’s Office of Research and Development built a correction equation. When data is imported, the map displays only sensors labelled as outdoor, removes questionable data when internal sensors disagree, applies the correction equation, and then harnesses NowCast, EPA’s method for relating hourly data to the AQI, to show data in the context of the index.
The changes EPA and USFS released put a lot more information at the user’s fingertips. Now when users click on a monitor or sensor, they get the dashboard that shows them the current NowCast AQI, gives them quick information on how they may need to take precautions, and shows you whether recent air quality (usually the past 30 minutes) at the location has improved, worsened, or stayed the same.
U.S. government agencies have been adopting digital map show datasets about different topics, including the availability of the internet. As reported by OpenGov Asia, The National Telecommunications and Information Administration (NTIA) released a new publicly available digital map that displays key indicators of broadband needs across the country. This is the first interactive, public map that allows users to explore different datasets about where people do not have quality Internet access.
The public “Indicators of Broadband Need,” comes from both public and private sources. The interactive digital map helps illustrate which parts of the U.S. report internet speeds that fall below the Federal Communications Commission’s current benchmark for fixed broadband service: 25 Mbps downstream, 3 Mbps upstream.