

New Zealand’s official data agency, Stats NZ, shared that it is now much easier to track what the Kiwis are buying and selling internationally with the New Zealand trade dashboard.
According to a recent press release, the new trade dashboard includes a map of the world, wherein one can just click on any country from Afghanistan to Zimbabwe in order to see how much New Zealand trades with that country.
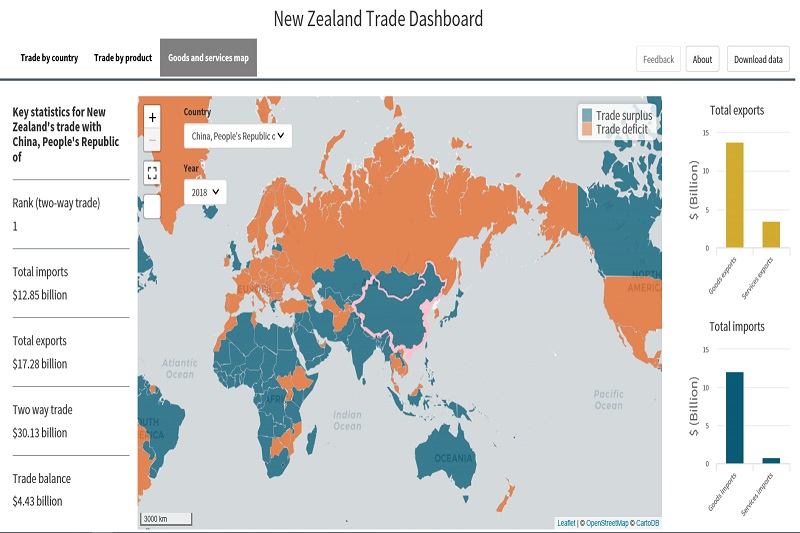
New Zealand Trade Dashboard
It aims to appeal to a wide range of customers, from those curious about how many dairy products are being exported, and where they go, to customers wishing to download trade data for further analysis.
It is designed reportedly to be responsive and viewable on any electronic device. However, using a desktop computer, laptop or tablet is recommended for best performance.
The data is for both goods and services, with annual figures from 2013 to 2018. There is also an option to download data in CSV files.
It shows export and import data for goods and services by country and commodity type by bringing this information together from various Stats NZ sources.
The New Zealand trade dashboard includes some content previously published as part of Global New Zealand.
It also builds on another experimental dashboard New Zealand’s two-way trade with the world published in March 2019.
Functions available
The dashboard has a section called ‘Trade by country’ that include details of key goods and services trade.
A section called ‘Trade by product’ shows the values of specific imports or exports such as an aircraft from the United States, or the value of wool exports to China.
The New Zealand trade dashboard makes it easier to explore the country’s trade ties instead of sifting through tables of data.
The dashboard shows just how far the trade connections go around the world.
Two-way trade pertains to the total goods and services exported from and imported into New Zealand.
China is New Zealand’s biggest market, with a two-way trade of both goods and services worth more than NZ$ 30 billion for the year ended December 2018.
Greenland, meanwhile, is at the other end of the scale, with a ranking of 222nd for a two-way trade at just NZ$ 214,079.
The dashboard proves that New Zealand has both ends of the world covered, with exports to Antarctica worth about NZ$ 2.4 million.
The dashboard is experimental. Hopefully, users will provide feedback about what they like about it and how it can still be improved.
Additional information about the dashboard:
- The current data is for the year ended in December
- All values are in NZD
- Last updated in May 2019