

A sociologist from the Massey University and a demographer from Statistics New Zealand helped develop the Auckland section of a new international data comparison site, created by the German-based Max Planck Institute for the Study of Religious and Ethnic Diversity.
According to a recent report, the new interactive online tool visually displays data about Auckland’s fast-growing and increasingly diverse migrant population.
This information will give government agencies, and groups such as employers and the media, a detailed understanding of super-diversity.
Superdiversity, as the tool is called, is an accessible way to find information on the nuances and trends about diversity and migration.
It is also designed to provide an understanding about differences between and within migrant communities.
The tool’s interactive graphics allow users to fill in key characteristics such as age, sex, ethno-cultural background and immigrant status.
This will allow them to see the predicted socio-economic prospects under five indicators: employment, tertiary qualifications, home ownership, income and English language ability.
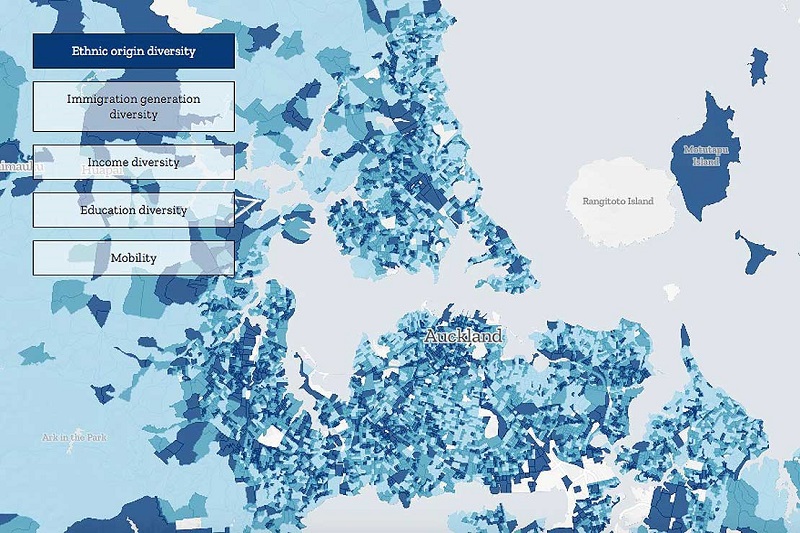
Moreover, it maps data for a precise visual display of the geographical distribution of migrant communities, with cross-tabulation of data on a range of socio-economic and lifestyle indicators.
The project focuses on three gateway cities, namely Auckland, Vancouver and Sydney in order to develop this new tool.
All three are examples of super-diversity where more than 25% of the population are born overseas and immigrant-related diversity has shaped these cities.
The University’s sociologist, Distinguished Professor Spoonley, worked on the diversity site with fellow demographers studying international trends in immigration, and who are concerned at recent debates that often simplify and define migrant groups by a narrow set of characteristics.
This, therefore, can result in misrepresenting and distorting the realities of immigration.
According to the expert, while many tend to talk about “the Chinese community” or “the Indian community” as if they are homogenous entities, the reality is that there are major differences within every migrant community based on age, gender, education and socio-economic status or the length of time in New Zealand.
Looking at the Chinese community in Auckland, for instance, those aged between 18 to 25 years are very different from those aged 40 to 45 in terms of their English language use, work experiences, family relationships and lifestyle.
It is important that policy makers, businesses and employers, as well as the wider society, have a better understanding and appreciation of these complexities if they want a more harmonious, cohesive society.
The site says that, “nearly 40 per cent of metropolitan Auckland’s residents, as recorded in the 2013 census, were born outside New Zealand, and the corresponding figures for Sydney and Vancouver in 2016 were, respectively, 43 and 41 per cent. All three are on a path to become ‘majority-minority cities’, with populations that trace their ancestry to Asia, Latin America, and Africa projected to exceed those who identify as European in origin.”