
Peel away layers from a mummy still inside its casket, going down to the bones, seeing the amulets around its neck in astonishing detail. Conduct a virtual autopsy of a person killed in a traffic accident. Or solve a 5500-year-old murder mystery.
All this through data visualisation combined with an interactive, multi-touch, intuitive interface, so easy to understand, that even a child could use it.
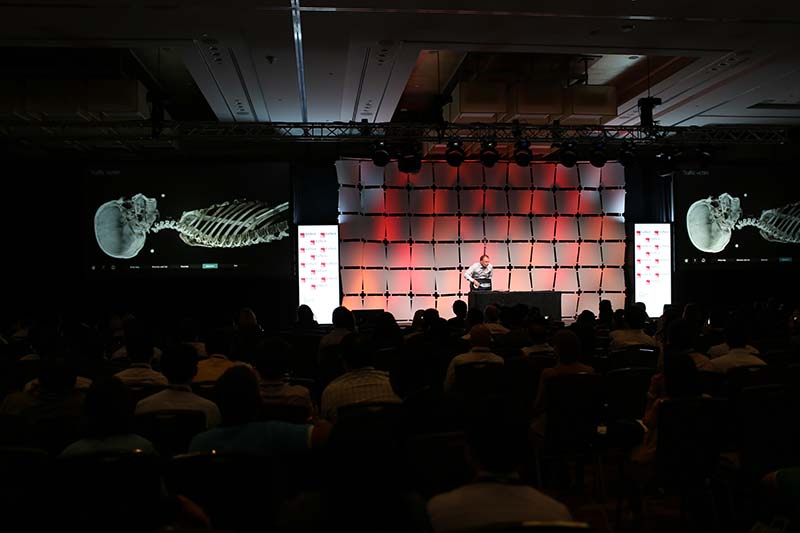
Dr. Anders Ynnerman demonstrated the above and more during a presentation at EmTech Asia 2017. He spoke about a new paradigm of science communication, enabling science by combining scientists’ visual tools with data exploration and presenting it to the public so that they can experience the magic of being a scientist. These installations are being used in several leading museums in North America and Europe.
Dr. Ynnerman studies fundamental aspects of computer graphics and visualisation, in particular dealing with large scale and complex data sets. He is head of the division for Visual Information Technology and Applications (VITA) at the University of Linköping, Norrköping, Sweden and director at the Norrköping Visualization Center. He has held both positions since 1999. He is also one of the co-founders of the Center for Medical Image Science and Visualization.
From 1997 to 2002 he directed the Swedish National Supercomputer Centre and the Swedish National Infrastructure for Computing (SNIC) from 2002 to 2006 he directed . Dr. Ynnerman is a member of the Swedish Royal Academy of Engineering Sciences and a board member of the Swedish Foundation for Strategic Research.
OpenGov sat down with Dr. Ynnerman, learning about the challenges of rendering and interactivity and exciting potential applications of his work in designing interfaces for autonomous systems and decision support systems.
What are the challenges faced in this kind of visualisation?
The first challenge is the data size. It’s very large datasets. To enable interactivity, you need to render the data and generate the pictures very fast. There can be no lag at all. We are doing 60 fps. generating each image from scratch, from raw data. There is a lot of research behind that, to be able to do that in real time. Thanks to the development of graphics processing units that we are seeing on the market, we can do it now.
If you want to put it out into the public domain where you have inexperienced users, like we are doing, it presents another challenge. You need to have an interface that makes it possible to have easy interactions.
The final challenge is how do you tell the stories around the data. People get excited about the content that we have but it is primarily the story behind all the data and the technology. It’s a new way of communicating science in terms of semi-interactive stories and reaching a new level of engagement from the audience.
What kind of computing resources are required?
That’s the thing. It’s not very much. What I showed here is just using the standard graphics processing unit that you can buy for a few hundred dollars. The CT (Computed Tomography) scanner is the expensive part. Everything else is very cheap.

CT scanners have been there since the 70s. What are the advances which have happened since then which have made such visualisations possible?
In 1972, when the first CT scanner came out, you had images that were 32×32 px in resolutions and you just had one slice. What we have now in the 40 years that have passed since, is resolutions of 1 mm and you have 25000 slices of data coming out of the machine in 2 seconds.
A lot of the algorithmic work, the mathematics is much better, increasing the scanning speed. Another reason is the detector itself. The detector is much more sensitive. You are down to the level where you can count individual photons.
The detector in the CT Scanner we used is about 60 cm wide. There is a ton of equipment in the machine and it rotates around at 1000 times per minute and there are no vibrations, nothing.
Basically, it is a lot of engineering on mechanics, much better detectors and computational algorithms.
Usually we see advanced visualisation techniques being used by researchers. How did you come up with the idea of public oriented use?
We have a science centre that is very closely related to the research centre. We just saw the opportunity to really take scientific data, scientific methods and let people play with it. And they were fascinated with that. In the medical domain and beyond.
We did the same thing with astronomical data. We let people play with it. We tell stories about all kinds of data that have scientific relevance. This is the disruption in science communication. Instead of making animations, simulations, media productions, we do the storytelling using the data.
How do you see this interactive communication of science evolving?
I think there will be more and more work on increasing engagement. You can even turn visitors into producers themselves, so that as a visitor to a museum they leave behind a legacy. It could be a crowdsourcing of the discovery process.
We are going into two different directions, each with its own challenges.
One is going down to the micro-level, so that we can look at more and more detail, at things like human cells. So that you become an explorer of the data and the molecular structure inside a cell.
The other dimension we are looking at is time itself. What I showed now is static data. But if you start looking at the time resolution, then you have further interesting problems in terms of data handling but you can also tell very exciting stories. If you are going to visualise things, like blood flow, dynamically over time, then you have to replace say 20 GB of data on your scan for each time-step in the animation.

What are the other applications of this technology?
We see applications in virtually all scientific domains. We have a lot of people that are contacting us about visual interfaces for data analysis. People are dealing with data that is too large, with too many dimensions. We can help them to reduce and make sense of the data, so that they can make informed decisions.
It is also of relevance in things like autonomous systems, what kind of visual interface do you need for an autonomous system in the future.
Let me put it this way. 10 or 15 years ago, we had something called smart homes. A smart home was a place where you had display systems in each of the rooms telling you the temperature was, humidity and many other details.
I think that was a bad idea. Because we do not need all that information. Visualisation is all about reducing the amount of information.
In a smart home of the future, I would like to have some sort of representation, maybe a hologram. When I come back home, the hologram has a human dialogue with me. It tells me that there was a water leak, and a plumber was called to fixed it.
I want to enable the use of human-level communication interfaces. I want to be able to offload your cognitive load. I call these systems cognitive companions. Because they are your companion, they help you. The rooms with all the display systems don't help you. They are stressful.
This is true for all systems that we are dealing with in autonomy, that we need to have that kind of system that takes away complexity for you. So, that you can focus on the things that are important for you.
Decision support systems have the same problem. They are overloaded with information. You need to reduce that in such a way that you can trust the system and you can feed back your insights into it.
People will not drive cars anymore. The car will talk to you and ask you where do you want to go, which road do you want to take. Or say decision support when you are investing in the stock market. These systems are pushing things down to shorter and shorter time-frames.
But at least for the time being, for the foreseeable future, there will be humans involved in all of these decision and support systems. You cannot go any shorter than a minute, because then you cannot have a human decision. A minute is about the time that it takes for us to cognitively process inputs.
Then you need to have appropriate human interfaces to all these systems. The best human interfaces we have are the visual ones, the human eye is the best way of consuming informtion.