
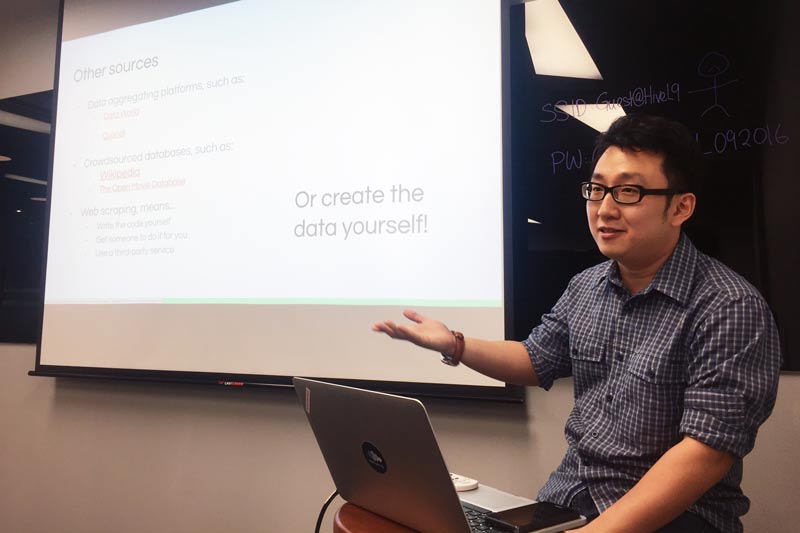
Above: Lin Zhaowei, Consultant, Data Science Division, Government Technology Agency of Singapore; Photo courtesy: Data Science Division, Government Technology Agency of Singapore
In April 2015, Prime Minister Lee Hsien Loong described his vision of Singapore as ‘a safe and secure data market place. A place where companies can easily conduct testing, and extract insights on market research, on consumer trends. A place where data can be shared in order to unlock value and innovation. A place where the Government releases many data sets to the public to build applications and services.’
Open data sharing is one of the key priorities in Singapore’s Smart Nation journey. Opening up datasets and APIs (Application programming interface) can encourage citizens to make better informed decisions in their daily lives. It can drive innovation, with developers creating new applications and services for fellow citizens. It is about catalysing a civic innovation movement from the ground up.
Data.gov.sg was launched in 2011 as an open data repository of government datasets. However, the datasets and APIs were not as polished and standardised initially as they could be, nor as relevant and understandable to the layman. The government subsequently shifted focus from quantity to quality of datasets, to ensure that data is machine-readable, and that it is easily understandable for the public. The public beta of the new portal was launched in July 2015.


Data.gov.sg currently has 990 datasets on the website, which is expected to increase to 1000 in a few weeks. The higher frequency datasets, primarily environment and transport data, are on the Developers’ page, launched in April 2016. The last quarter of 2016 saw an average of around 200,000 page views and 2,000 to 3,000 downloads of datasets every month.
OpenGov met with Lin Zhaowei, Consultant, Data Science Division, Government Technology Agency of Singapore to learn more about how the objectives of data.gov.sg are being achieved. He talked about ensuring the quality, usability and usefulness of data, privacy concerns, Open Data Licence and API terms, and increasing awareness about the availability and potential of open data.
Data visualisations and dashboards
In 2015, we launched a portal with a new look and new data standards. We wanted to make the data more understandable to people, which is why at the same time we also launched data visualisations and dashboards.
For the layman, charts are the main touchpoint. They are not going to be interested in 10,000 rows of data. They just want to be able to see the rough trends and that’s what we hope to accomplish through the visualisations. At the same time, because the data is already in a tidy, machine-readable format, power users can work with it.

Snapshot from Data.gov.sg

For example, in 2015, there was a bout of haze. We had a dashboard showing real-time PSI readings, the idea was to present data in a way that is meaningful to people. Right now, we have a general Singapore at-a-glance dashboard. We select datasets that we think would be interesting to people, for example, population, PM2.5, dengue incidences. These have direct relevance for general citizens.
We have dashboards based on 9 topics, economy, education, environment, finance, health, infrastructure, society, technology and transport.
Ensuring data quality
We placed our data quality guide on our Github page. The guide was first disseminated to agencies and refined based on feedback and consultations. During the second half of 2016, we released the guide to the public as well. Members of the public can suggest enhancements, which helps us ensure that our data is of the right quality and presented in a consistent way.
Last year, we needed to migrate datasets from the old site to the new one. At the launch of the new portal, we had around 100+ datasets that we cleaned up on our own, based on our new data quality standards. Then we asked the agencies to implement the standards and submit datasets based on our requirements. We worked through examples with the agencies, explaining what the data is used for and why it should be structured this way.
We also held workshops, as well as individual consultations with the agencies. After they submit the data to us, we do another round of checks before we publish the data to make sure that it is consistent and of the right quality.
Say you have transport related datasets, based on vehicle type, such as cars, motorcycles and so on. We have to ensure that spellings are consistent. For instance, spelling motorcycle with a hyphen in one set and without one in another dataset, would cause issues in combining or comparing datasets. We have to avoid such problems and make it easy for users. We want our data to be useful and we want people to be able to use it without having to waste time cleaning the data.
Data ownership and privacy
Data is collected, governed and protected under strict safeguards according to personal data management rules that all government agencies comply with. These rules largely mirror the Personal Data Protection Act which governs personal data protection in the private sector, but are written in context of the public service.
One-stop shop for data
Previously, any agency which wanted to provide real-time data would have their own webpage, and sign-up process for users. So, if I need data from agencies A, B and C, I would need to sign up for three different websites.
With data.gov.sg, we wanted to create a one-stop portal. You can sign up here and access data from different agencies, without having to jump around to figure out which agency has which data.
It is part of our mandate to help members of the public find and use information they need from the different government agencies. We are the middleman in that sense. We are working to get more APIs on this website. We are working with individual agencies to figure how to retrieve the data and update it here, with minimal lag.
There’s another benefit to having data from different agencies on one website. It can spark fresh ideas and innovation. Say I am interested in traffic data. I come to this site and I see that there is rain and wind data available. Can I use that as well and draw insights?
Open Data Licence and Terms of use
The Ministry of Finance worked on the Open Data Licence, in consultation with many agencies including GovTech We drew inspiration from the open data definition, provided by Open Knowledge International. Readability was one of the things we considered. If we make it too complex and filled with legalese, users are not going to read it or understand it.
Just as we do with our datasets, with our licences also, we want to make it easily understandable. We went through many revisions to ensure that the language is accessible. Jargon is not used unless it is absolutely necessary.
Previously there was no standardised licence for data published by government agencies. Certain agencies, like the Singapore Land Authority are selling some of the information, such as map data. Each agency had their own version of a data licence. There is a bunch of licenses that you have to read and understand when using published data.
So, we wanted to make it clear that if it was published as open data, then it is free to use, this encourages more people to use data. It also adheres to the international norms on what open data really is.
Previously, you had to inform Data.gov.sg if you wanted to use the data for commercial purposes. That requirement has been eliminated. But we have an attribution clause and we would like it if people attribute us when they use the data.
Outreach
Outreach is a continual process for us. The Data.gov.sg blog aims to illustrate interesting trends and highlight meaningful applications of data. For example, our data science team recently penned a piece on how the Circle Line rogue train was caught with data, while another piece studied data on the NEA grading and hygiene level of hawker food.
We also make it a point to actively engage with citizen groups, such as data science meet-up groups. We have spoken at a couple of these meet-ups to talk about what we have been doing and also to gather feedback on what other data scientists think we should be doing.
We also held a data visualisation workshop for journalists recently, to go through the basic techniques on using data for data journalism. The response to these engagements have been good. We can’t quantify the outcome yet, but it’s something that we will continue to do.
We have an upcoming competition for students in our universities, polytechnics, junior colleges and institutes of technical education. It is called the National Data Visualisation Video Challenge. Participants have to analyse and use open data to create a short video presentation. We hope to see collaboration between students in different disciplines, such as those in the computer science, analytics and visual media. We want the students to discover ways to present data in a creative and layman-friendly format to their friends and families, who might be intimidated by data.
The way ahead
We have stabilised the platform over the past year and a half. Our main concern now is getting the content out there. We want to work more closely with agencies, in order to respond more quickly to requests from the public, so that we can release more useful datasets.
We also want to increase the number of APIs and improve their reliability, minimising disruptions.
Work will continue for improving the website. We will enhance the user experience by adding functionality, such as allowing people to compare datasets.
As we wrap up our migration of the data, we will start assessing how useful the data is. We will start looking at generating reports for each agency, how frequently their data is accessed, how many people are downloading it. If no one is looking at certain datasets for say a year and a half after publication, we want to stop maintaining them. We want to make sure that the data we are publishing is actually of use.